Metrics show detailed statistics of visits to your sites, extracted from server access logs. At the top of each page, you choose the domain and period. A traffic overview is a summary of how many people are coming to the site and how much data is being transferred.
1. Main figures
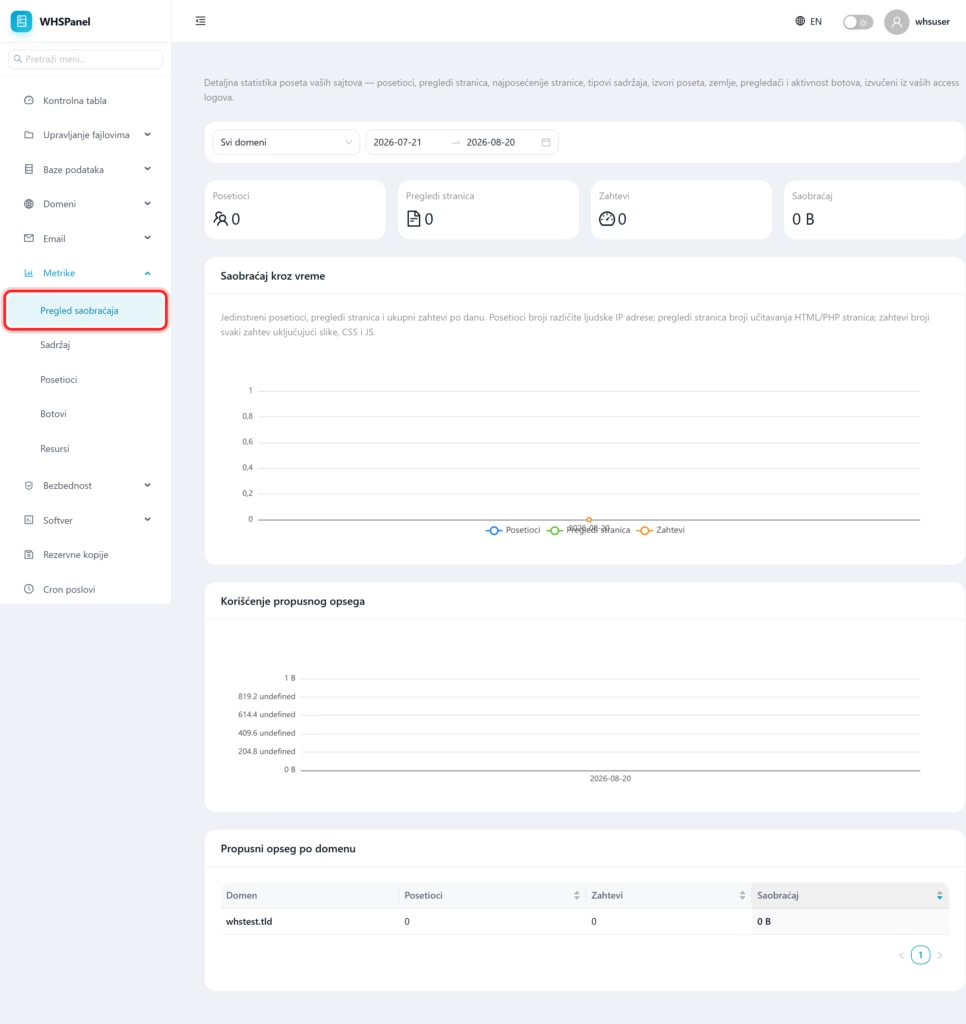
Open in the menu Metrics well Traffic overview. Four cards provide the most important figures for the selected period:
| Card | What counts? |
|---|---|
| Visitors | Different human IP addresses (how many real people were coming). |
| Page views | Loading HTML and PHP pages. |
| Requirements | Every single request, including images, CSS and JavaScript. |
| Traffic | Total amount of data transferred. |
2. Graphs and by domain
Traffic through time shows visitors, page views and requests per day. Bandwidth usage and table Bandwidth per domain show how much data each domain has transferred.
Note: the number of requests is always much higher than the number of visitors, because one visit loads dozens of files (images, styles, scripts). For a real picture of attendance, see Visitors and Page views, and Traffic for bandwidth consumption.