The Content section shows what is most requested on your site and how the server responds to those requests. From there you can see which pages are getting the most traffic and if there are any errors that need to be fixed.
1. Most visited pages and files
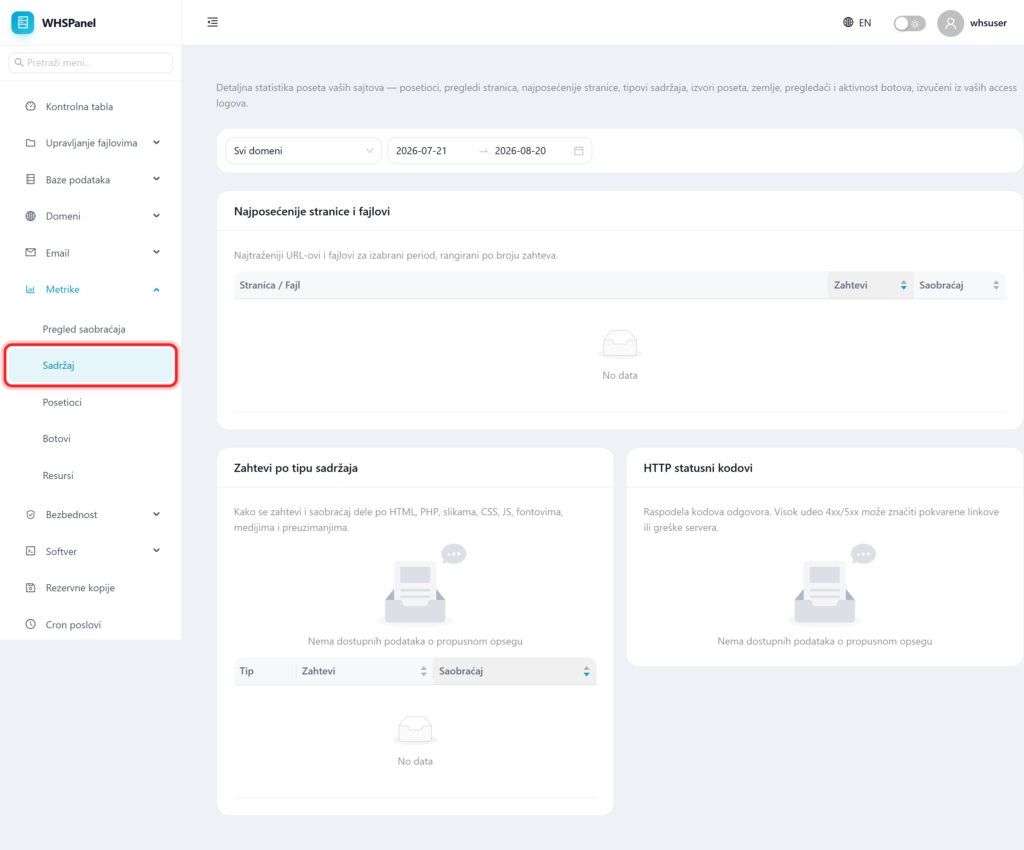
Open in the menu Metrics well Contents. The first table ranks the most requested URLs and files for the selected period, by number of requests and by traffic.
2. Content types and status codes
| Display | What is he saying? |
|---|---|
| Requirements by content type | How requests and traffic are divided by HTML, PHP, images, CSS, JavaScript, fonts, media and downloads. You immediately see what consumes your bandwidth the most. |
| HTTP status codes | Distribution of response codes. High share 4xx or 5xx could mean broken links or server errors. |
Note: if you see a lot in the status codes
404, you have broken links or missing files. If images in your content types stand out in terms of traffic, consider optimizing your images or enabling caching to speed up your site.